
What this tutorial covers
Use the visual topology designer to assemble a research architecture and inspect its resulting charts.
Before you start:You need access to the product and should ideally follow the tutorial using your own real parameters or data. The screenshots below were manually rematched to avoid the image/topic mismatches seen in the previous version.
Step-by-step workflow
1Open the module
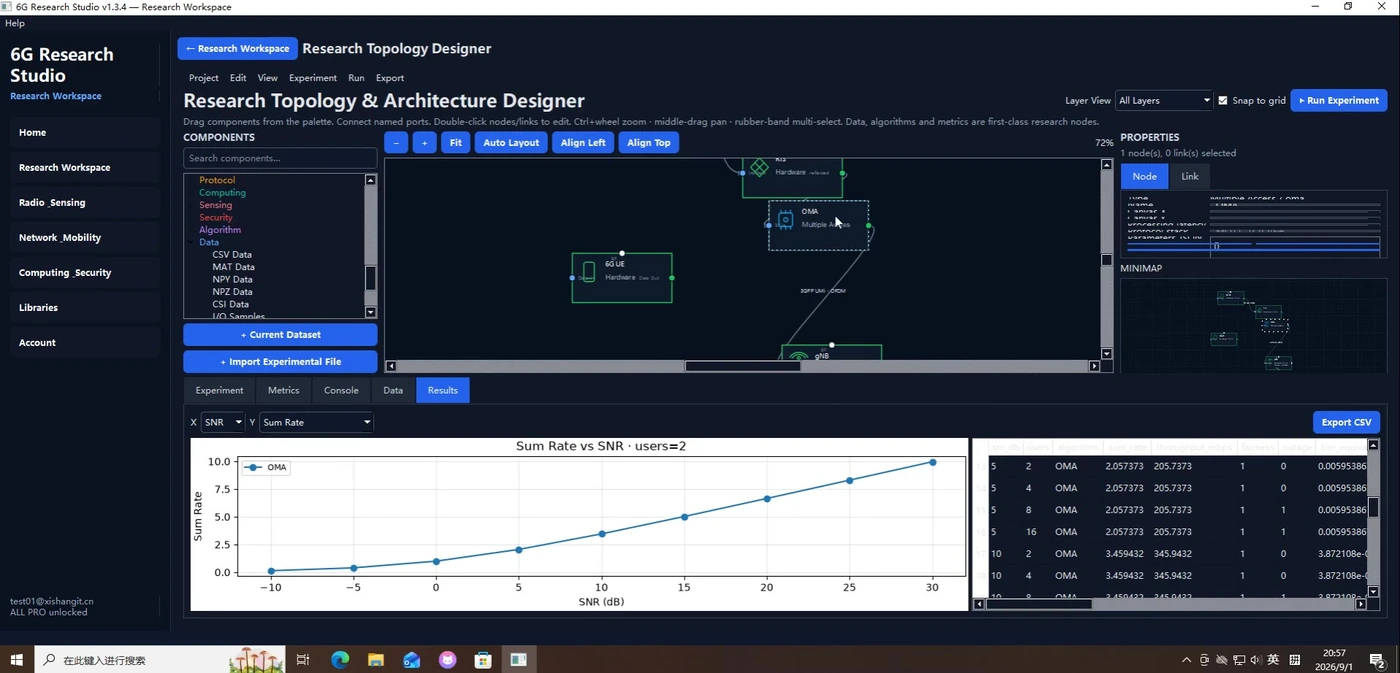
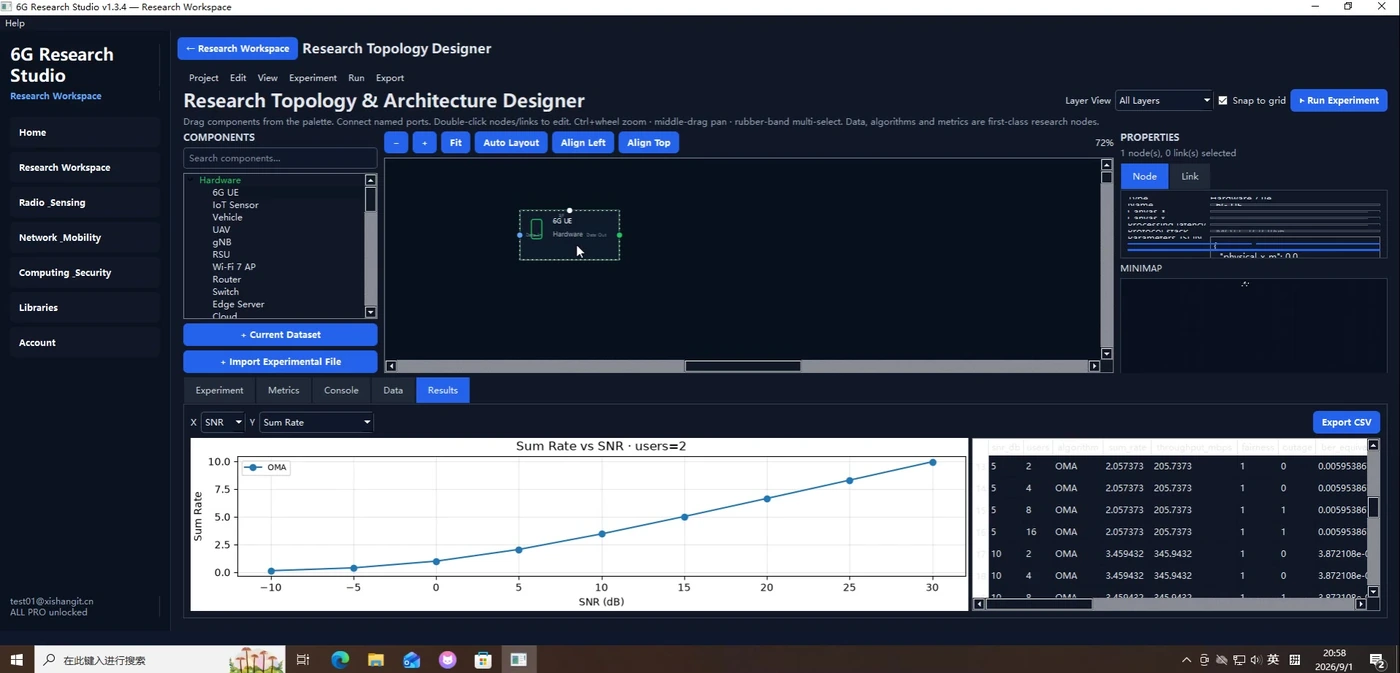
Open Research Topology & Architecture Designer. Confirm that the visible page really matches the tutorial topic before changing any settings.
2Configure the input
Prepare and check nodes, links and experiment parameters.
3Run and watch the status
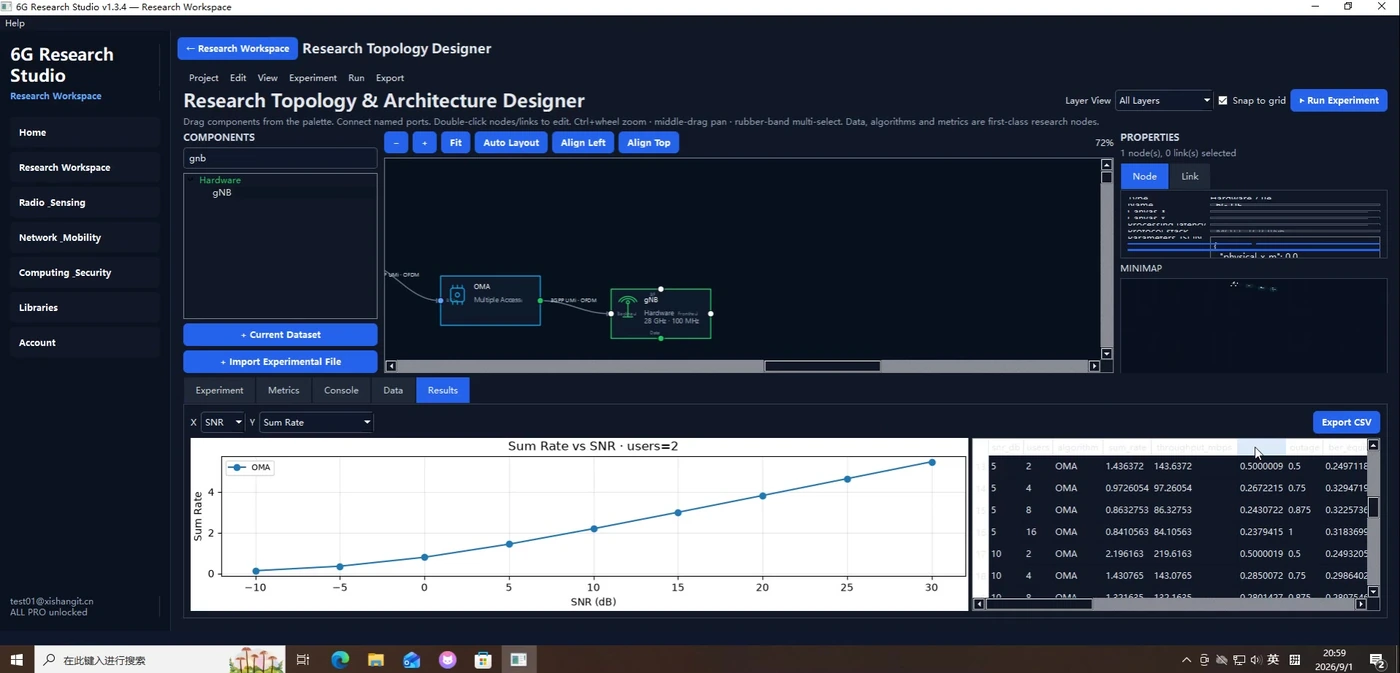
Connect the architecture on the canvas and run the experiment. Watch the visible status, plot or log area while the workflow is running.
4Inspect the result
Pay special attention to the topology graph together with curves and result tables.
5Verify and iterate
Since this workflow links several blocks together, verify the connection logic as you build the topology. Change one meaningful parameter and rerun so you can verify whether the output changes in the expected direction.
How to read the result
- The main output of this workflow is the topology graph together with curves and result tables.
- Read the result together with the exact inputs used for the run; a screenshot alone rarely tells the whole story.
- Since this workflow links several blocks together, verify the connection logic as you build the topology.
Troubleshooting & practical tips
- If nothing changes, first confirm that the correct module is open.
- If the output looks unrealistic, check units, field mapping and input scale first.
- For comparisons, change one key parameter at a time whenever possible.